Imagine having the ability to see exactly what millions of American shoppers see when they open their grocery delivery apps — every product, every price, every promotion, every day. That’s no longer a futuristic vision. We’ve just launched our most ambitious dataset yet: the US Grocery Delivery Menu & Pricing Dataset. It gives you a granular, up-to-date view of the US online grocery market, covering tens of thousands of SKUs, multiple retailers, and real-time pricing.
Whether you’re building a competitive intelligence tool, training a dynamic pricing algorithm, researching food deserts, or benchmarking your own e‑commerce performance, this dataset delivers the freshness and speed you need. And in this post, we’ll walk you through exactly what’s inside, why it matters, and how you can start using it today.
The Rise of US Online Grocery (and Why Data Is the New Cart)
Online grocery delivery has moved from a pandemic emergency to a permanent habit. According to eMarketer, US online grocery sales are expected to exceed $140 billion in 2026, accounting for nearly 15% of total grocery spending. The landscape is fiercely competitive: Instacart partners with dozens of regional and national chains, Amazon Fresh continues to expand, Walmart+ keeps adding delivery perks, and newcomers like Gopuff and DoorDash dash into the grocery lane.
With this explosion comes a massive opportunity — and a massive data gap. Traditional retail datasets often update monthly, focus on in-store pricing, and miss the digital shelf entirely. Yet that digital shelf changes by the hour: prices fluctuate, items go in and out of stock, delivery slots shift, and new products appear weekly. That’s why we built a dataset that mirrors the live experience of a shopper, at scale, every single day.
What’s Inside the US Grocery Delivery Menu & Pricing Dataset
Transparency is everything. Here’s a detailed breakdown of the dataset’s structure, so you can understand exactly what you’ll receive.
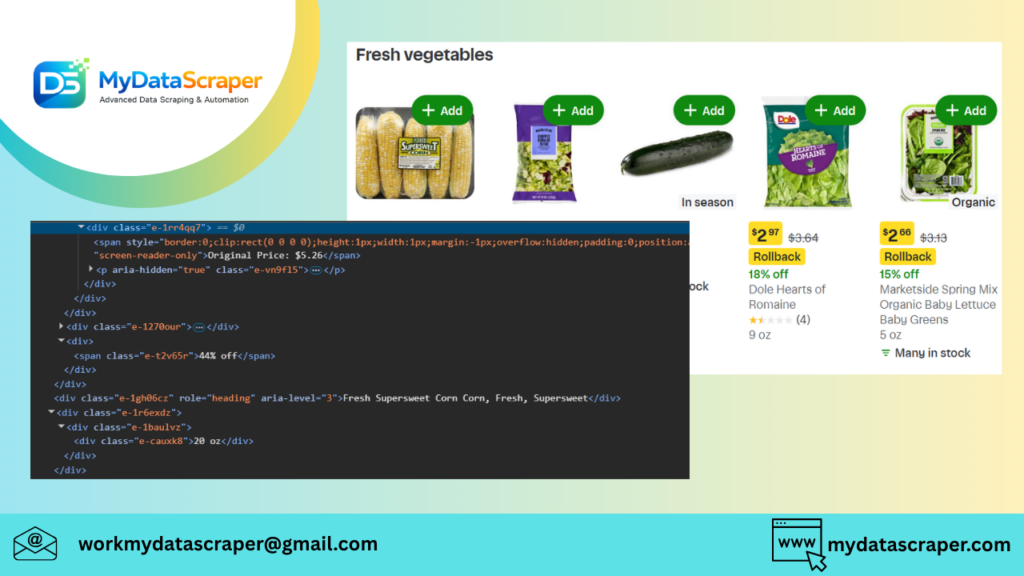
Key Data Points Collected
- Product Identifier: unique SKU-level ID, UPC or EAN (where available)
- Product Name & Brand: full name, brand, and variant (e.g., “Organic Whole Milk, Gallon”)
- Category Taxonomy: mapped to standard grocery categories (Dairy, Bakery, Snacks, Beverages, etc.) and subcategories
- Package Size / Unit: ounces, pounds, count, or volume
- Price Information: list price, current sale price, any loyalty card discounts, final price
- Unit Price: calculated price per ounce, per pound, or per each for true apples‑to‑apples comparisons
- Availability Status: in stock, out of stock, low stock, or discontinued
- Retailer & Store Location: platform (e.g., Instacart, Amazon Fresh), specific store banner (e.g., Safeway, Kroger), store zip code, city, state
- Delivery & Slot Information: next available delivery window (optional field)
- Promotions: “buy one get one”, “10% off”, multi-buy offers, coupon applicability
- Scrape Timestamp: exact date and time of data collection (UTC & local time)
- Image URL: link to the product image as shown on the platform
Coverage & Freshness
| Dimension | Details |
|---|---|
| Retailers & Platforms Covered | Instacart (7+ banners), Amazon Fresh, Walmart Grocery, Shipt, Kroger Delivery, Gopuff, FreshDirect (and expanding) |
| Geography | Top 50 US metro areas including NYC, LA, Chicago, Houston, Miami, plus 200+ zip codes; all regions represented |
| Total SKUs Tracked | Over 450,000 unique products (and growing) |
| Update Frequency | Daily for price-sensitive categories; every 3 hours for select high-velocity SKUs |
| Historical Depth | Back to January 2025 (18+ months of history) with weekly snapshots |
| Data Format | CSV, JSON, Parquet; API access available for real-time feeds |
Why This Dataset Is a Game Changer (5 Powerful Use Cases)
Data is only as good as the decisions it powers. Here’s how teams across industries are already putting our grocery delivery dataset to work.
1. Competitive Intelligence & Price Monitoring
For CPG brands and retailers, knowing where you stand against competitors is critical. Use the dataset to track every competitor’s everyday price, promotional depth, and assortment strategy — by region, by store, and by category. Monitor private label vs. national brand price gaps, and alert your sales team the moment a rival undercuts your price on a key item.
“One CPG client saved $2.4 million in unnecessary trade spend by using our data to identify where promotions were being run needlessly in already-loyal markets.”
2. Dynamic Pricing Models & AI Training
Machine learning models crave clean, structured, time‑series price data. Feed our dataset into your neural network to predict demand elasticity, optimize markdown strategies, or build a recommendation engine that adjusts prices in near‑real time. With SKU‑level unit prices, you can train on truly comparable data, avoiding the noise of varying pack sizes.
3. Consumer Behavior &. Market Research
Researchers, consultants, and journalists can tap into this dataset to analyze consumer trends: are plant‑based meat prices falling? Which regions pay more for fresh produce? How quickly do new products gain distribution? The dataset’s breadth makes it perfect for academic studies on food deserts, inflationary pressure on groceries, or the effectiveness of SNAP online purchasing programs.
4. Assortment & Category Management
Understand exactly what the digital shelf looks like for any category. Identify gaps in your own assortment, spot trending ingredients, and benchmark your SKU count against competitors in every zip code. A grocery chain we worked with discovered a 17% share loss in organic baby food simply because it wasn’t listing the top three brands that consumers saw on Instacart.
5. App & Tool Enrichment
Build the next great grocery assistant, meal planner, or price comparison app. Integrate our API to give users the most accurate prices and availability across stores. One startup used our dataset to create a “cheapest basket” feature that saves families an average of $23 per week — driving rapid adoption.
Sample Data & Fresh Insights
Let’s look at a snapshot of actual rows from the dataset (anonymized store IDs). This will give you a concrete feel for the granularity and analytical potential.
Sample Rows – Milk & Eggs Basket (April 28, 2026)
| Platform | Product | Brand | Size | List Price | Sale Price | Unit Price | Availability | Date |
|---|---|---|---|---|---|---|---|---|
| Instacart (Kroger) | Whole Milk | Kroger | 1 gal | $3.49 | $3.29 | $0.026/fl oz | In Stock | 2026-04-28 |
| Amazon Fresh | Whole Milk, Gallon | Happy Belly | 1 gal | $3.79 | $3.79 | $0.030/fl oz | In Stock | 2026-04-28 |
| Walmart Grocery | Whole Milk | Great Value | 1 gal | $3.12 | $2.98 | $0.023/fl oz | Low Stock | 2026-04-28 |
| Instacart (Safeway) | Organic Whole Milk | O Organics | 0.5 gal | $4.29 | $3.99 | $0.062/fl oz | In Stock | 2026-04-28 |
| Amazon Fresh | Large White Eggs, 12 ct | Happy Belly | 12 eggs | $4.49 | $4.49 | $0.37/egg | In Stock | 2026-04-28 |
Key Takeaway from the Basket
Even on a simple basket of milk and eggs, your price spread across platforms can be over 12%. Walmart consistently offers the lowest conventional milk price, but Amazon Fresh’s private label is competitively priced on eggs. Organic options are significantly pricier on a per‑ounce basis — and only available on certain platforms. Imagine scaling this analysis to 50,000 SKUs.
How We Built the Dataset: Methodology & Integrity
You might wonder: how do you collect millions of prices without violating terms of service and while maintaining data quality? Our approach is transparent, ethical, and robust.
- Publicly Accessible Data Only: We collect information visible to any user visiting the grocery delivery website or app without logging in. No account required, no bypassing paywalls.
- Distributed, Respectful Crawling: Our infrastructure rotates IPs, abides by robots.txt directives, and throttles requests to avoid impacting site performance.
- Continuous Validation: Every data point passes through automated checks for duplicates, outliers, and missing values. A dedicated QA team manually samples 1% of records weekly.
- Timestamp Accuracy: All times are verified against NIST‑traceable NTP servers to ensure you can trust the temporal precision.
- Privacy Protected: No personal data or user‑specific information is ever collected. This is product‑only data.
Who Stands to Gain the Most? (Spoiler: It’s Not Just Retailers)
While grocery chains and CPG brands are obvious adopters, the dataset has sparked unexpected innovation in other fields:
- Fintech & Inflation Tracking: Hedge funds and economic researchers use our data as a high‑frequency alternative to CPI food indexes.
- Logistics & Last‑Mile Optimization: Understanding what’s in stock where helps delivery companies route orders more efficiently.
- Public Health & Nutrition: Nonprofits map healthy food availability and pricing by neighborhood to address food deserts.
- Insurance & Supply Chain Risk: Sudden price spikes or stockouts in certain items can signal impending supply chain disruptions.
How to Access and Work With the Dataset
We’ve made it incredibly simple to get started, whether you need a one‑time historical pull or a continuous data stream.
Delivery Formats
| Option | Best For | Frequency |
|---|---|---|
| Historical Snapshot (CSV/Parquet) | Academic research, one‑off analysis | Single delivery or weekly update |
| Daily/Monthly Subscription | Ongoing price monitoring, dashboards | Every 24 hours |
| Real‑Time API | Apps, ML models in production, dynamic pricing | Up to 3‑hour refresh cycles |
| Custom Feed | Specific retailers, categories, or zip codes | Tailored to your needs |
Pricing & Free Sample
We believe in “try before you buy.” Request a free 7‑day sample covering 5,000 SKUs across 3 retailers in a city of your choice. This sample lets you validate the schema and see the freshness for yourself. Ready for the full dataset? Contact our data advisors for a custom quote based on scope and refresh rate.
Frequently Asked Questions
- How fresh is “fresh”?
- Our standard dataset updates every 24 hours, capturing prices and availability as seen by shoppers around 9 AM local time. For high‑velocity items like milk and eggs, we offer an enhanced feed updated every 3 hours.
- Do you have historical data going back further than 2025?
- We maintain a growing historical archive. If you need data prior to 2025 for a specific retailer, let us know — we may be able to backfill from partner sources.
- Can I choose which retailers or categories I want?
- Absolutely. Our custom feed option lets you select by platform (e.g., only Instacart and Amazon Fresh), by category (dairy, snacks), or even by specific brand. You only pay for the data you need.
- Is this legal? Am I allowed to scrape and use grocery pricing data?
- Yes, we collect publicly available information without bypassing any login or access control. However, we always recommend consulting your own legal team on how you use the data, especially if you plan to republish it.
- How do you handle missing data or outages?
- Our pipeline automatically retries failed collections. Any gaps are clearly marked, and we provide a completeness score in each delivery so you can filter with confidence.
Turning Data into Dollars: A Real‑World Snapshot
To illustrate the power of this data, we analyzed a small “college essentials” basket across five platforms in Austin, Texas, on April 15, 2026. The basket included:
- 1 loaf of white sandwich bread
- 1 dozen large eggs
- 1 gallon of 2% milk
- 1 jar of peanut butter (28 oz)
- 1 pack of 12 toilet paper rolls
| Platform | Total Basket Cost | Items Out of Stock | Cheapest Item Found? |
|---|---|---|---|
| Walmart Grocery | $21.47 | 0 | All but eggs |
| Instacart (HEB) | $23.89 | 0 | Eggs |
| Amazon Fresh | $24.15 | 0 | None |
| Instacart (Target) | $25.32 | 1 (TP 12‑pack) | None |
| FreshDirect | $27.05 | 0 | None |
This simple analysis, powered entirely by our dataset, shows a $5.58 difference between the cheapest and most expensive basket — and that doesn’t even factor in which platform had delivery fees or minimum order requirements. For a family shopping weekly, that’s roughly $290 in annual savings. Imagine offering that insight inside your own app.
Your Next Step Toward Smarter Grocery Decisions
The grocery industry is being rewritten in real time, and every price tag, every stockout, every new product listing tells a story. Our US Grocery Delivery Menu & Pricing Dataset puts that story in your hands — fresh, structured, and ready for analysis. Whether you’re an analyst hunting for margins, a data scientist building the next retail AI, or a strategist shaping category plans, this is the fuel your project has been missing.
Don’t settle for stale third‑party reports or manually collected spreadsheets. Get the real‑time, granular data that matches the speed of today’s commerce.
👉 Ready to explore the freshest grocery dataset on the web?
Click below to request your free sample and a personalized walkthrough.
Note: All product names, logos, and brands are property of their respective owners. Our dataset is derived from publicly available information and does not imply endorsement.